
Company Analysis: Assurant - Connected Living Q4 FY2025
Margin's Calling Home...

Key Findings: CL revenue +11.9% to $5,379m | NWP +20.3% to $4,165m | Adj. EBITDA +3.7% to $506m. EBITDA margins compressed 160bps over three years to 9.4%, predating Best Buy onboarding. Devices serviced declined 21% over three years; a three-month hold time extension produces an 11% combined impact on trade-in economics. Home Warranty entry via Compass targets higher margin underwriting income but the US market is structurally fragmented ($4.6bn, ~70 providers). Updated APP implied EBITDA of $251m at 11-13x suggests $2.8-3.3bn divestiture value; Assurant the obvious buyer.
The set up for the FY2025 Q4 earnings release last week1 was telegraphed the day before with the announcement that Compass International Holdings will be Assurant’s launch partner for their entry into the Home Warranty market2. Management should be happy with their earnings call performance as they guided Home Warranty to grab the biggest slice of the mentions pie with analysts asking 14 of the 24 references. They might also be pleased that the majority of analysts bumped up the stock target price without much interrogation of Connected Living’s subdued 1.4% quarterly YoY improvement or the 3.7% yearly gain coming in at $506m. Charlie Lederer at BMO Capital Markets had a bit of a go at the top line growth versus the earnings gap, but I’m not sure the response quite got to the bottom of it.
Recap
Assurant Inc. (NYSE: AIZ) is a Fortune 500 speciality insurer headquartered in Atlanta, operating across 21 countries and through two segments: Global Lifestyle and Global Housing. Much of the housing business is unique to the US with Assurant tracking home loans to determine that insurance remains in place. Global Lifestyle is a much broader business with global applicability. The reporting unit comprises Connected Living (device protection, extended service contracts, trade-in and upgrade programmes, device processing and a financial services outlier focused on credit card benefit services) and Global Automotive (extended warranties for vehicle protection and an emerging heavy vehicle line of business). Connected Living is the larger of the two business lines with $506m in Adj. EBITDA versus Automotives $296m.
Historically, Connected Living’s core business has been B2B2C device protection and extended warranties distributed through carrier, retail and OEM partnerships and according to the financial supplement to the latest earnings, they now protect 66 million devices globally. Whilst numbers at this level are hard to validate externally, that puts them as the largest protection provider alongside Asurion.
Since collaborating with T-Mobile US on the Jump! early upgrade programme in 2013, Assurant have been developing and acquiring capabilities beyond insurance to capture value across trade-in processing, device refurbishment, repair networks, logistics and device supply. The integrated lifecycle approach is central to Assurant’s competitive positioning and client stickiness with a new multi-year reverse logistics agreement announced with T-Mobile US in Q3 last year. Other key partnerships include AT&T, Comcast (Xfinity), Charter (Spectrum) and more recently Best Buy and Verizon’s Total Wireless.
FY2024 and FY2025 were characterised by management as a period of prioritised investment in new client programmes and capabilities, with FY2025 positioned as the year those investments would begin to deliver returns. Let’s have a look…
Performance
Key Performance Metrics
- CL Revenue: $5,379m (+11.9% YoY) | Q4 record $1,462m (+13%)
- CL Adj. EBITDA: $506m (+3.7%) | Q4: $121m (+1.4%)
- CL EBITDA Margin: 9.4% (FY2024: 10.1%, FY2022: 11.0%)
- Net Written Premiums: $4,165m (+20.3%) | Q4: $1,405m (+47.9%)
- Devices Protected: 66.3m (+2.9%) | Devices Serviced: 22.7m (-5.8%)
- Assurant Group Adj. EBITDA excl. cats: $1,734m | Adj. EPS excl. cats: $22.81
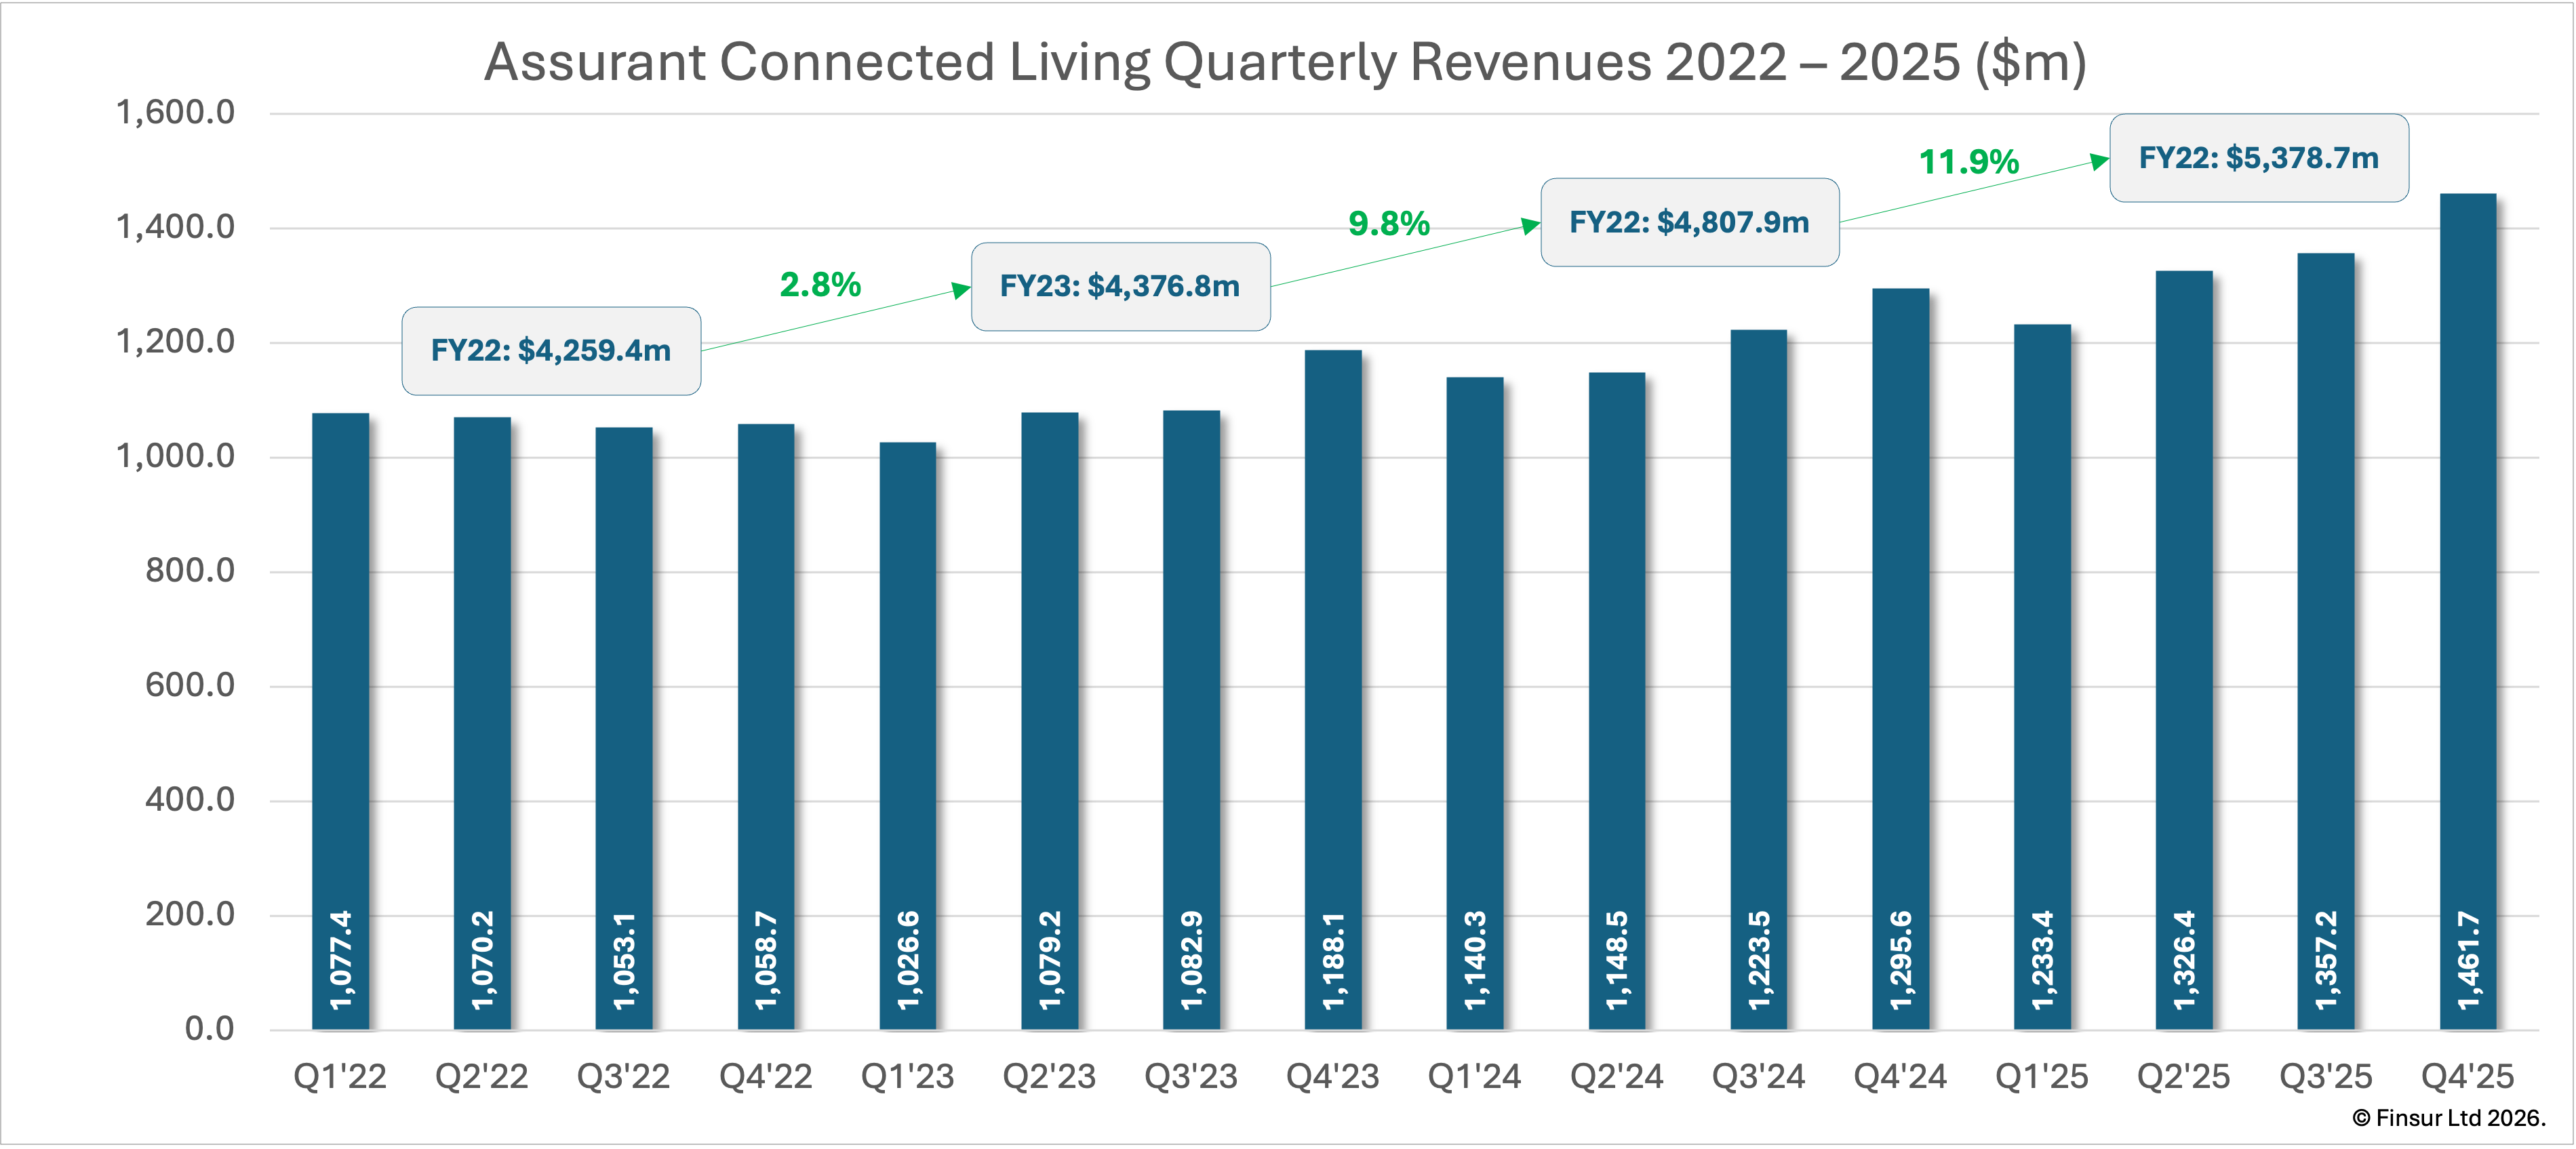
Connected Living’s (“CL”) revenue includes net earned premiums from the insurance business, revenue and fees from reverse logistics, trade-in processing, repairing, refurbishing and selling mobile and other electronic devices on behalf of clients. For FY2025 revenue was up 11.9% YoY at $5,379m (FY2024: $4,808m). On a constant currency basis, growth was 12.5% with FX providing some modest drag.
CL’s four-year quarterly revenue trajectory sat in a narrow band between 2022 and 2023 with limited growth and accelerated from mid-2024 breaking through $1,200m in Q3 and has climbed at a pretty decent clip until reaching the highest quarter on record in Q4 2025 at $1,462m and 13% above Q4 2024.
For contrast Allstate Protection Plans (APP) reported FY2025 revenues of $2,300m, up 16% on the previous year from $1,987m. Assurant's FY2025 10-K confirms the product mix has shifted materially. Mobile device solutions now account for 53.0% of CL revenue (FY2024: 50.6%, FY2023: 44.8%), crossing the majority threshold for the first time, whilst ESC has fallen to 34.4% (FY2024: 38.8%, FY2023: 44.7%) and financial services has risen to 12.6% (FY2024: 10.6%). At 34.4%, ESC revenues of approximately $1,851m remain broadly comparable to APP's $2,300m, but the direction of travel is notable: ESC has dropped over ten percentage points in two years. Rather than the Best Buy onboarding shifting the balance back toward ESC, the mobile device lifecycle layer is taking a larger share of CL revenue, not smaller.
CL’s net written premiums (“NWP”) jumped 20.3% to $4,165.3m for the year (FY2024: $3,461.2m). The quarterly growth acceleration was notable (Q1: +0.4%; Q2: +9%; Q3: +21%; Q4: 48%) with Q4 NWP of $1,405.2m being far the highest on record. CFO, Keith Meier confirmed the Q4 acceleration was substantially down to the Best Buy Geek Squad Protection back-book being onboarded, consisting of multi-year contracts that will earn through more gradually than they came on board.
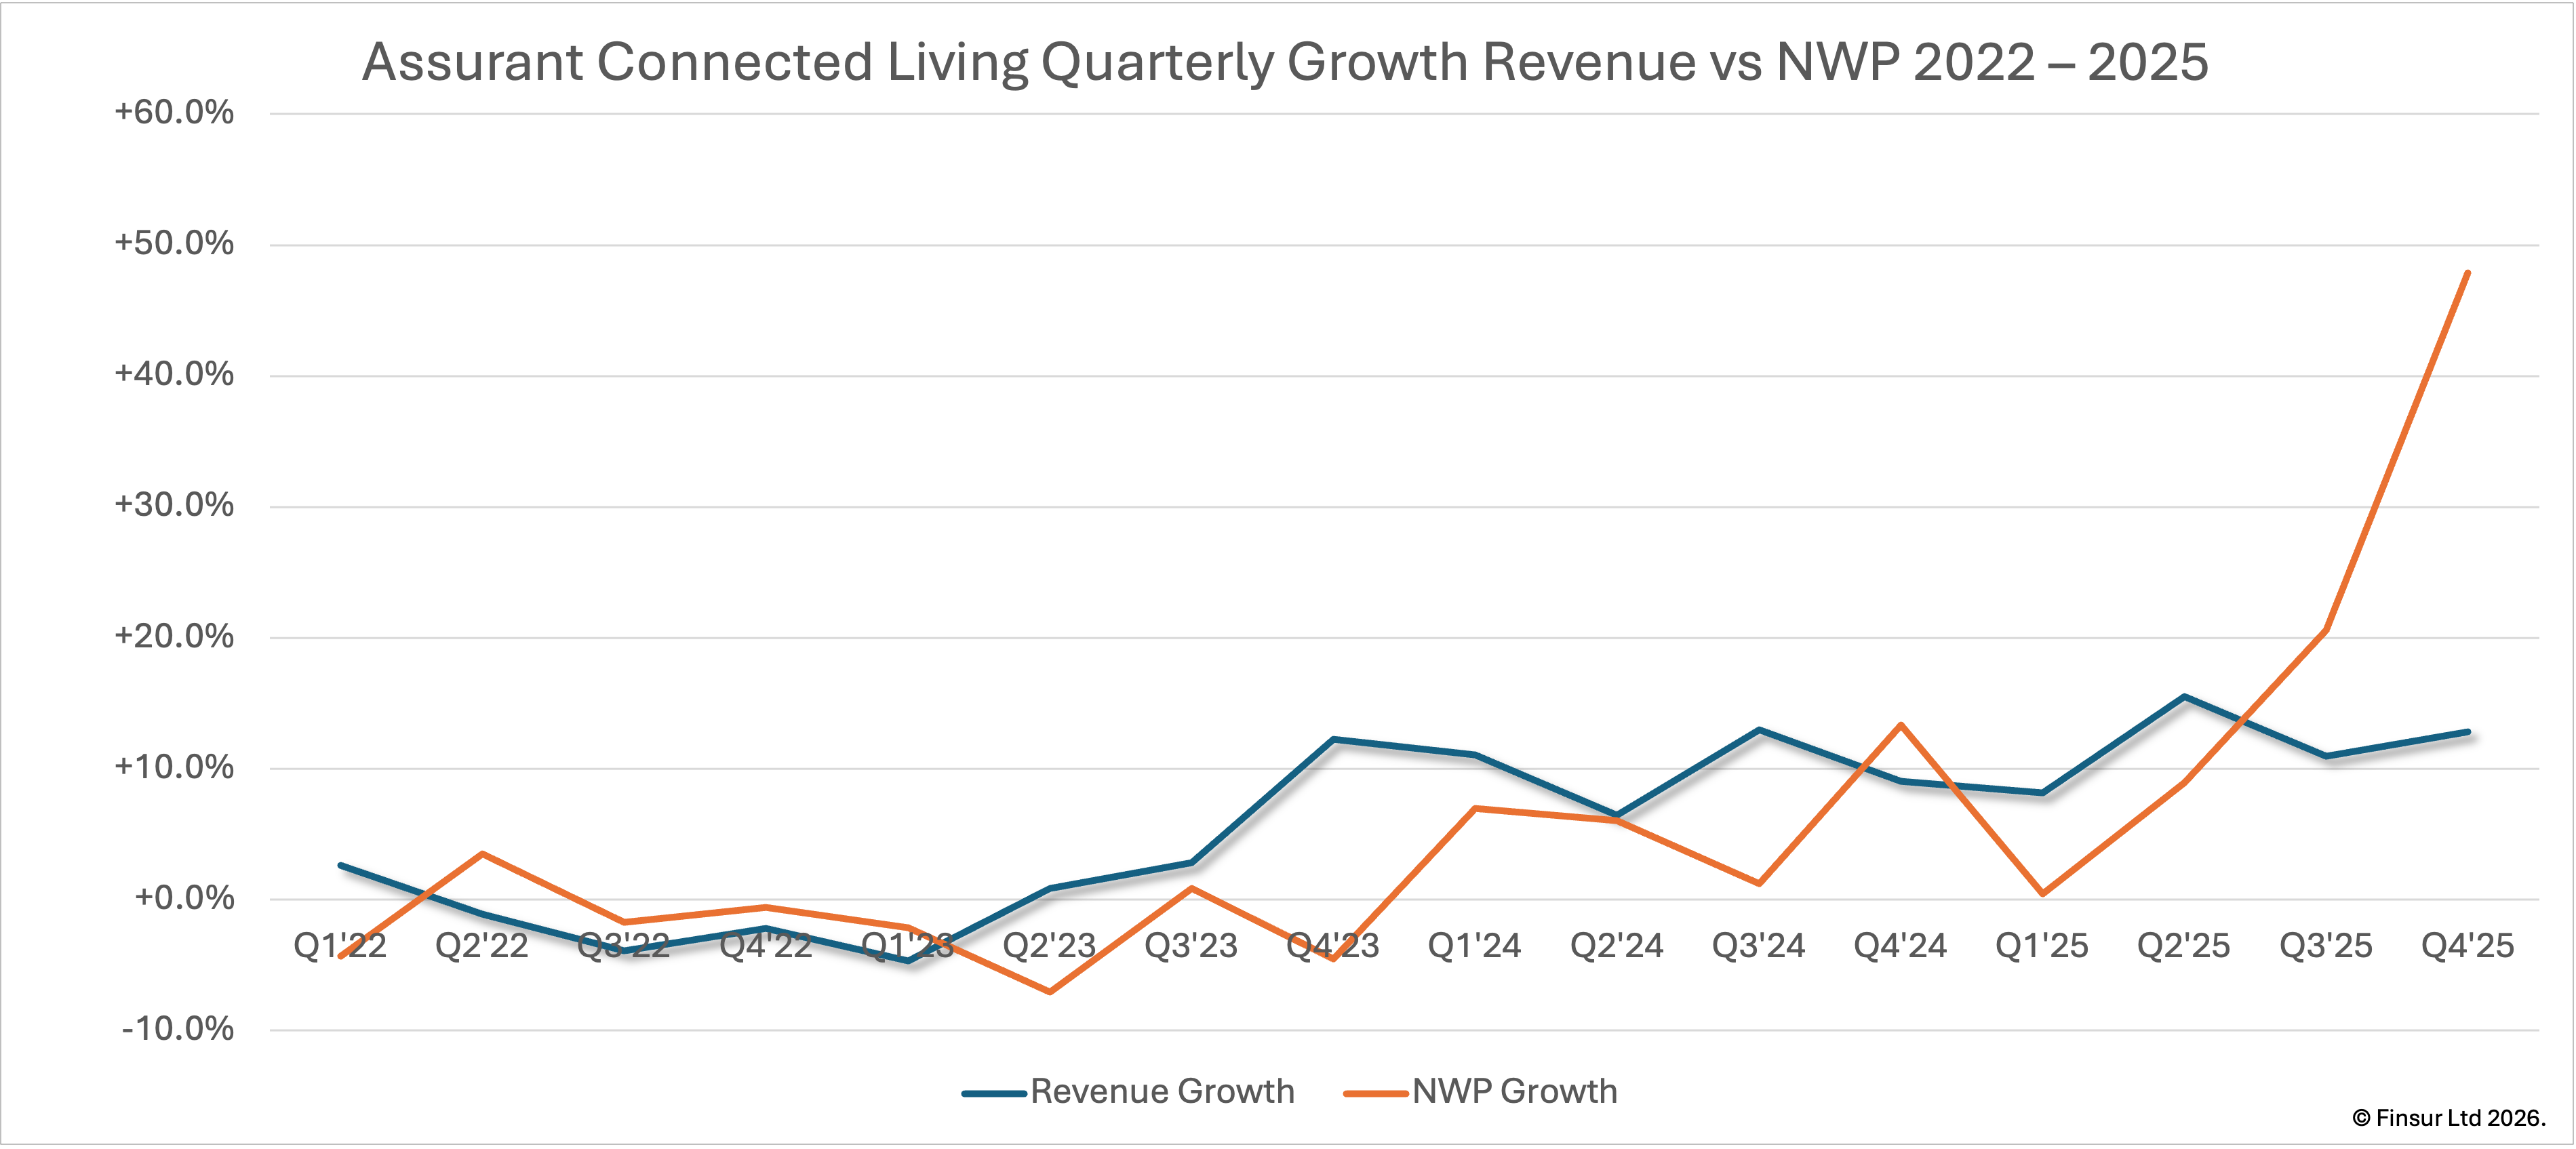
The gap between NWP growth (FY2025: 20.3%; Q4: 47.9%) and the revenue growth (FY2025: 11.9%; Q4: 12.8%) represents the revenue locked in but not yet earned with the pipeline able to underpin management’s high single digit EBITDA growth guidance for FY2026. Contrast this with APP’s NWP growth at 7% versus 16% earned premium growth demonstrating the opposite dynamic, implying that APP is earning through the prior year premiums rather than building forward momentum. They’ll be fighting hard for new business over the coming year.
Whilst I can’t imagine it’s the most accurate metric, Assurant’s Devices Protected provides a valuable sense of scale. Global covered devices stood at 61.9m in Q4 2022 and declined slightly to 61.3m devices by the end of 2023. Mirroring the revenue trajectory, 3.1m devices were added in FY2024 and another 1.9m devices added in FY2025 taking the total to 66.3m.
Devices Serviced is another interesting metric. According to the financial supplement, it’s defined as the number of devices for which Assurant provides value through trade-ins and upgrade, technology, claims fulfilment, repair capabilities, logistics and asset disposition. It captures every device touched across the mobile lifecycle, not solely consumer trade-ins. In FY2022, Devices Serviced hit 28.6m and has declined 21% over the intervening three years to 22.7m in FY2025. Q4 remains the seasonal peak driven by the annual iPhone launch cycle with the seasonal pattern holding even as the annual trend declines: Q4 2025 6.7m devices; Q4 2024 6.5m; Q4 2023 7.5m and; Q4 2022 7.5m. That might be worth pausing on.
Apple reported a record quarter on the back of iPhone 17 sales and both Verizon and AT&T reported strong equipment sales supporting the claim. TMUS, Assurant’s largest carrier client and with whom they have signed a multi-year logistics agreement in 2025, reported Q4 equipment revenue of $5.4bn, up 14% YoY, with postpaid device upgrade rate rising from 3.6% to 3.8%. Given the breadth of Assurant’s metric, I would have thought a record sales / upgrade cycle should see devices flowing through multiple channels. Instead Devices Serviced barely moved. Either the dollar value is translating but not the volume, some of the upgrade activity is flowing through channels Assurant does not touch, or the longer device hold times are dampening response even during peak upgrade cycles.
The value story supports the first interpretation. Assurant’s own quarterly market reports show the dollar value returned to customers through trade-ins growing 40-60% YoY through 2025, with average device age at trade-in reaching an all-time high of 3.88 years in Q2 2025. Fewer devices processed at higher per unit values, consistent with consumers holding onto handsets longer but trading in more valuable devices when they do upgrade.
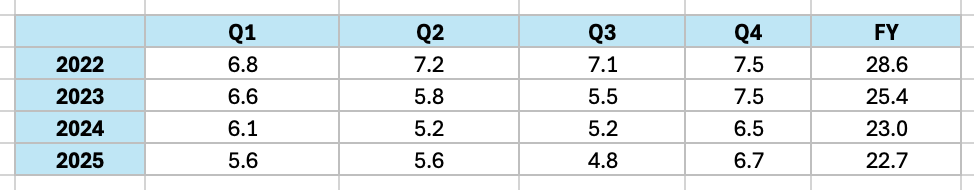
A quick check of the quarterly Devices Serviced metric, to determine if there was some additional lag as devices passed along the chain, revealed an increasing concentration around the iPhone launch cycle. In FY2022, devices serviced ranged from 6.8m to 7.5m across quarters. By FY2025 the range had widened to 4.8m to 6.7m, with Q3 2025 the lowest single quarter on record. As total volumes shrink, the business is becoming more dependent on a single annual event to drive throughput. Unsurprising given Apple’s market dominance perhaps, but notable.
Continue reading for:
Why EBITDA margins have compressed 160bps over three years and what the 10-K cost of sales data reveals about the trajectory
A scenario model quantifying the sensitivity of Assurant’s trade-in pipeline to consumer hold time extensions, and why the AI upgrade narrative doesn’t hold up
Assurant’s Home Warranty entry, the margin recovery thesis and what the competitive landscape actually looks like versus mobile
An updated valuation of a potential inorganic target and the competitive dynamics that may be shortening the window
The full report is also available as a PDF for download here.