
Market Update: Navigating a contraction
Structural changes on the horizon for the UK smartphone market....

Introduction
Back in the late 1970s Henry Mintzberg introduced the concepts of Intended, Emergent and Realised Strategy1. The “Intended” strategy refers to the original plan, the “Emergent” strategy arises from the organisation’s actual actions, and the “Realised” strategy is the one that ends up getting implemented. This happens to be a fantastic model, not least because it gives strategists an excuse to include all the stuff they couldn’t think of and business development teams a home for the opportunistic, non-strategic, revenue chasing. Despite my irreverent take, the environment in which strategy takes place is always emerging, particularly in our sector. Like everyone else, I can’t tell precisely where new device sales will land, but what appears to be going on right now seems more than a trend. The evidence points to a structural contraction.
Hypothesis
As European smartphone shipments decline and global vendors deploy increasingly aggressive strategies to maintain growth, the UK market reveals the structural reality facing mature economies: by extending device ownership consumers are driving a permanent demand contraction that industry measures will not be able to fully offset.
Evidence
In 2020, a couple of IMF researchers suggested that the planet had reached Peak Smartphone in 2016 at 1.47bn units2. It’s an interesting paper to look back on. Joannes Mongardini and Anit Radzikowski noted supply chain evolution triggered by trade tensions between America and China with India and Vietnam the winners from Foxconn’s hedging decisions3. Sound familiar?
They also introduced a model to forecast future smartphone sales which basically states, if more people start using smartphones or if people replace them faster, the market expands, whereas if growth slows or people begin to keep their phones longer, the market contracts. Beautifully simple.
More recently, after the recovery in 2024 (6-7% growth to approximately 1.23bn units45) momentum has stalled. Q1 2025 managed just 0.2-3% growth, with Canalys noting "the peak replacement cycle came to an end"6. Europe exemplifies this shift, after a dead cat bounce of 5% in 2024, shipments fell 2% in Q1 2025.
In addition, and perhaps more compelling, there is clear evidence of the ownership shift coming from consumers. In mid-May I conducted a UK survey with a nationally representative sample of 500 consumers on the YouGov platform. Within this cohort, the average phone duration was 3.40 years whereas the intended new phone duration increases to 3.67 years. This may not sound significant but the aggregate hides important shifts in behaviour.

The additional 9.7% of consumers intending to keep phones for more than 5 years represents a fundamental shift. This means 1 in 4 UK consumers now plan to keep their phone for over 5 years, compared to just 1 in 6 previously. Additionally:
26.5% intend to keep their new phone longer than their previous one
59.9% intend to keep it for the same duration
Only 13.7% intend to keep it for a shorter period
The 2:1 ratio of consumers planning longer versus shorter ownership periods indicates a clear directional trend towards extended lifecycles.
Impact
As regular readers will know, quantifying the UK smartphone market, or any market for that matter is complex, with different methodologies yielding varying results. The Competition and Markets Authority's 2021 analysis of £11.7 billion7 in device shipments suggests approximately 18-20 million total units annually, whilst current industry estimates based on the UK's 12-15% share of Canalys's 32.4 million European smartphone shipments, point to 16-20 million units for 2025.
Assuming, therefore essentially flat sales since 2021 and applying a 20% discount to convert shipped volumes to actual consumer sales (sell-in to sell-out), yields approximately 14.4 million new device sales annually. Add to this refurbished devices, which according to my previous survey back in November8 currently account for approximately 16% of total UK sales gives us a total unit sales of 17.1m devices: 14.4m new and 2.7m refurbished. Current ownership averaging 3.4 years gives an installed based of approximately 58.1m devices9 representing 87 phones per 100 people.
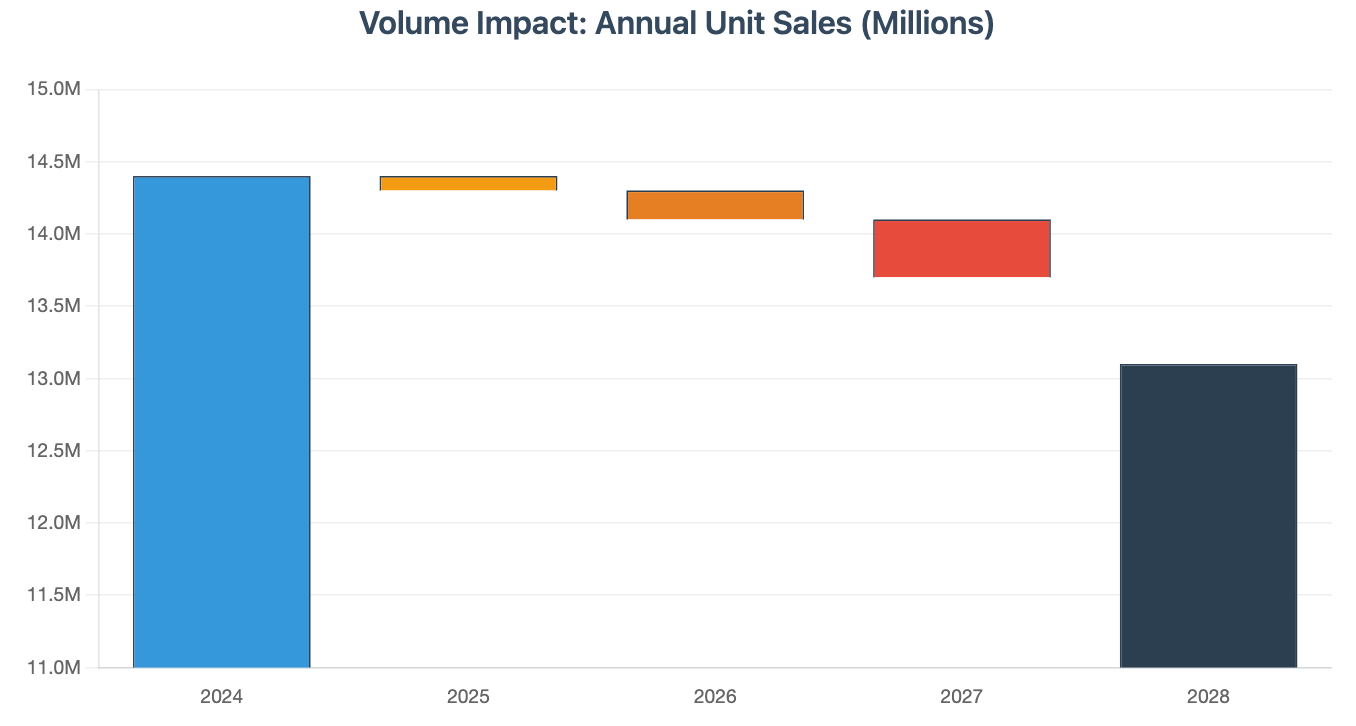
Rather than assuming immediate behavioural change across all consumers, we can use the above duration data to develop a cohort model reflecting the shift from 3.4 year average ownership to 3.67 years. This assumes that people who purchased phones before 2025 will largely complete their current replacement cycles based on previous intentions. Only consumers buying from 2025 onwards will follow the extended ownership patterns revealed in the survey data.
This approach produces a back-loaded impact timeline. Initial effects in 2025 prove minimal (14.4 million to 14.3 million units) as new buyers represent a fraction of the market. However, as extended-cycle cohorts accumulate, the impact accelerates significantly. By 2027, annual new sales contract to 13.7 million units, reaching 13.1 million by 2028 a cumulative 9.0% reduction driven purely by consumer behaviour change.
The refurbished market would face parallel pressures, contracting from 2.7 million to 2.5 million units as extended primary ownership reduces device availability for secondary sales. This secondary market decline occurs despite growing consumer acceptance of refurbished devices, highlighting the extension of primary use impacts the entire ecosystem. The transition pattern may explain why the industry underestimates the structural threat; the modest impact in 2025–2026 masks the approaching contraction. However, the survey intention data is clear and provides predictable market dynamics.
Adjacent markets will feel the effect too. Device insurance could face contradictory pressures with attachment rates increasing to protect devices intended for longer ownership and slower policy churn reducing new business volumes. Taking an average 14.4% attachment rate for new devices and an 8% attachment rate on refurbished devices10 and keep them constant, means an 8.9% drop in annual policy sales in 2028.
The trade-in market will confront increasingly complex dynamics and significant competitive friction. Fewer devices could enter trade-in pools as extended ownership reduces replacement frequency. Those devices emerging after a longer primary use phase may be of lower grade, carrying lower residual values. For the carriers with the lowest current trade-in rates pursuing GSMA pace-setting targets11, the maths becomes particularly challenging. Achieving volume growth in a structurally shrinking pool is going to require significant consumer incentive.
Working capital intensity increases across the supply chain as inventory turns slow and retailers must finance stock for longer periods, creating cash flow pressures particularly acute for smaller independent specialists who lack the balance sheet strength of major carriers and OEMs.
Why Now
There are several possible catalysts which are likely compounding to drive this specific moment for lifecycle extension:
Technology maturation ceiling - incremental improvements are no longer compelling enough to justify replacement. Even the native AI phone is seemingly being rejected by the UK consumer12
Economic pressures - continued pressure on household finances13 are likely to delay any expensive discretionary purchases that have no technological justification
Environmental consciousness - growing awareness of e-waste, sustainability messaging from brands themselves may beginning to have some impact
Software longevity - iOS/Android support extending to 5-7 years is reducing forced obsolescence pressure
Build quality improvements - devices are genuinely lasting longer physically
Market saturation effects - far fewer "wow" moments as innovation becomes incremental and it’s all about content anyway right?
Responses
I’ve grouped possible responses to the structural contraction into three broad categories: defensive, offensive and acceptance. Consider them scenarios, some approximation of future states.
Defensively, carriers and OEMs might increase promotional activity, further extend financing terms, combined with aggressive contract bundles. However, this may create a defensive trap with lower prices stimulating short-term demand but further eroding any economic incentive for frequent replacements, thereby accelerating the lifecycle extension that’s driving the contraction. Future guaranteed values like Samsung's Galaxy Club with its 50% guaranteed trade-in value and Recommerce's forward buyback schemes14 aim to secure device inventory before extended ownership cycles damage residual values. The 12-15 month window precisely targets Samsung's strongest trade-in period and pre-empts the value erosion that occurs when devices age beyond two years. The survey data supports this strategic timing, showing Samsung significantly outperforms Apple in the 1-2 year window (66.7% vs 40.0% trade-in rates), whilst Apple dominates in the 3-5 year window (45.0% vs 20.0%). Samsung's Galaxy Club window capitalises on their natural strength whilst avoiding their weakness in longer-term residual value retention.
The volume decline in device insurance will create genuine pressure on insurers and their agents to innovate their acquisition strategies rather than relying on natural market growth. They may increase attachment rates through more relevant marketing directed at longer lifecycles. They may increase premiums although this is always challenging through the major distributors or they may have to accept a smaller market. The survey indicates that consumers are increasingly looking towards household insurance add-ons for their cover as opposed to carriers, OEMs and retailers.
Offensively, the likes of Alchemy15, Foxway16 and Back Market investing in the circular economy to capitalise on the structural shift. Foxway's Estonian facility processed 1.5 million devices in 2024 with plans to triple capacity within five years. These players are building the infrastructure to monetise extended lifecycles by capturing value from the secondary and tertiary use phases that traditional OEM models ignore. You wouldn’t expect a note from me without my sector consolidation narrative, and the expected 9% volume contraction confirms acquisition opportunities for well-capitalised players to gain market share.
Expect further development of adjacent categories or pivoting toward B2B markets which have different replacement dynamics. Foxway’s CWS segment, for example focuses distinctly on serving the enterprise sector which has a broader product catchment with varying replacement cycles. Other consumer categories like tablets, wearables, and smart home devices may offer better margins versus smartphones.
Perhaps the more difficult response is acceptance. Can you imagine OEMs moving to biennial launch schedules? Aligning new products with actual replacement behaviour rather than attempting to resurrect obsolete 2-year cycles seems appropriate. However, this clearly carries inherent risk. Less frequent launches may actually reinforce longer ownership by reducing compelling upgrade opportunities - not that there appear to be any right now. The trade-off is potentially more meaningful generational leaps when launches do occur with residual values holding up as a consequence.
Apple's services revenue hitting $26.3 billion (23% of total revenue) to some extent demonstrates successful decoupling from device sales frequency. Admittedly, Apple are uniquely positioned here but they clearly acknowledge that customer relationship value lies in the extended device lifecycle rather than frequent hardware churn.
Alternative Theories
There are of course a number of alternative theories: the extended ownership intention could be a long, but temporary response to the continued cost-of-living pressure. This would suggest the 2025-2028 projections could reverse if household finances strengthen. Average smartphone prices may be crossing a psychological or economic threshold that no longer justifies frequent upgrades. The shift to direct purchasing17 as opposed to carrier subsidised models may be artificially extending replacement cycles. There may be some COVID hangover working through the system. Additionally, whilst the survey captured intended behaviour, actual consumer actions might differ significantly and, despite being a nationally representative sample, I accept there could have been some bias. Follow up surveys, would be valuable.
Conclusion
The evidence points toward a structural correction in the UK smartphone market driven by extended ownership cycles. Consumer intentions to increase average ownership from 3.4 to 3.67 years may appear modest, but translate into a 9% market contraction by 2028 with back-loaded effects. While alternative explanations including economic pressures, COVID normalisation, or direct purchasing all deserve consideration, the industry's early responses suggest market participants recognise this reality. Success will increasingly depend on maximising value from extended customer relationships rather than accelerating replacement frequency. The 2025-2028 period will prove whether this represents temporary adjustment or permanent structural change.
Right, I’m off to run for 24 hours - team event, not as bad as it sounds, I hope.
Peace,
sb.
Ibid.
In previous articles I have used an installed base value of 48m smartphones for the UK. I am wondering now if that was too small based on my latest calculations for this article.