
Raylo Group Limited Research Update
More proof that direct-to-consumer tech rental can have a place in the sector...

Key finding: Raylo achieved EBITDA positive status at £5.6m in FY2024, a £7.5m turnaround from the prior year's £1.9m loss. Revenue grew 42% to £27.9m whilst billing subscriptions increased 59% to 92,446, validating the device rental model's transition from theoretical promise to operational reality.
My last Raylo Group Limited (11554120) research update1 was a few months behind the filing schedule as I caught up with things last October. Happy to be more timely and provide an update on their FY2024 filing which was lodged on 30/06/2025. This time around though, I also need to refer to the Raylo Holding Limited (14477387) accounts as well because a few important data points have moved. So, on the heels of Grover’s woes2, let’s dive in and have a look at the latest…
Recap
Despite the working capital intensity and profit lag, I like the rental business model. From a consumer perspective there’s no big cash outlay, payments are regular and don’t change during the contract life, there are simple return and upgrade options, and the rental firm looks after the second or third lives of the device. It all fits perfectly within the Circular Economy ethos. Raylo embarked on this mission in 2018 and have been developing their capabilities since. In addition to offering their rentals direct-to-consumer, RayloPay was launched in 2021 which I think, allows their platform to operate in a B2B2C model. Why spend your own marketing dollars when you can spend someone else’s?
Just a few other points of order. First, recall that in the last filing, revenue dropped due to recognising income directly from consumer agreements rather than from selling off the receivables. Second, I am assuming that income from RayloPay has prompted a change in the subscriber metrics meaning the KPI probably makes more sense at the holding company rather than the operating company level. There are few other consumer focused technology rental companies operating with any scale which makes comparisons difficult. However, at £30.4m in annually recurring revenue (ARR) it feels like they’re pushing beyond start-up curiosity into scale-up territory.
Performance
FY2024 Key Metrics:
- Revenue: £27.9m (FY2023: £19.6m, +42%)
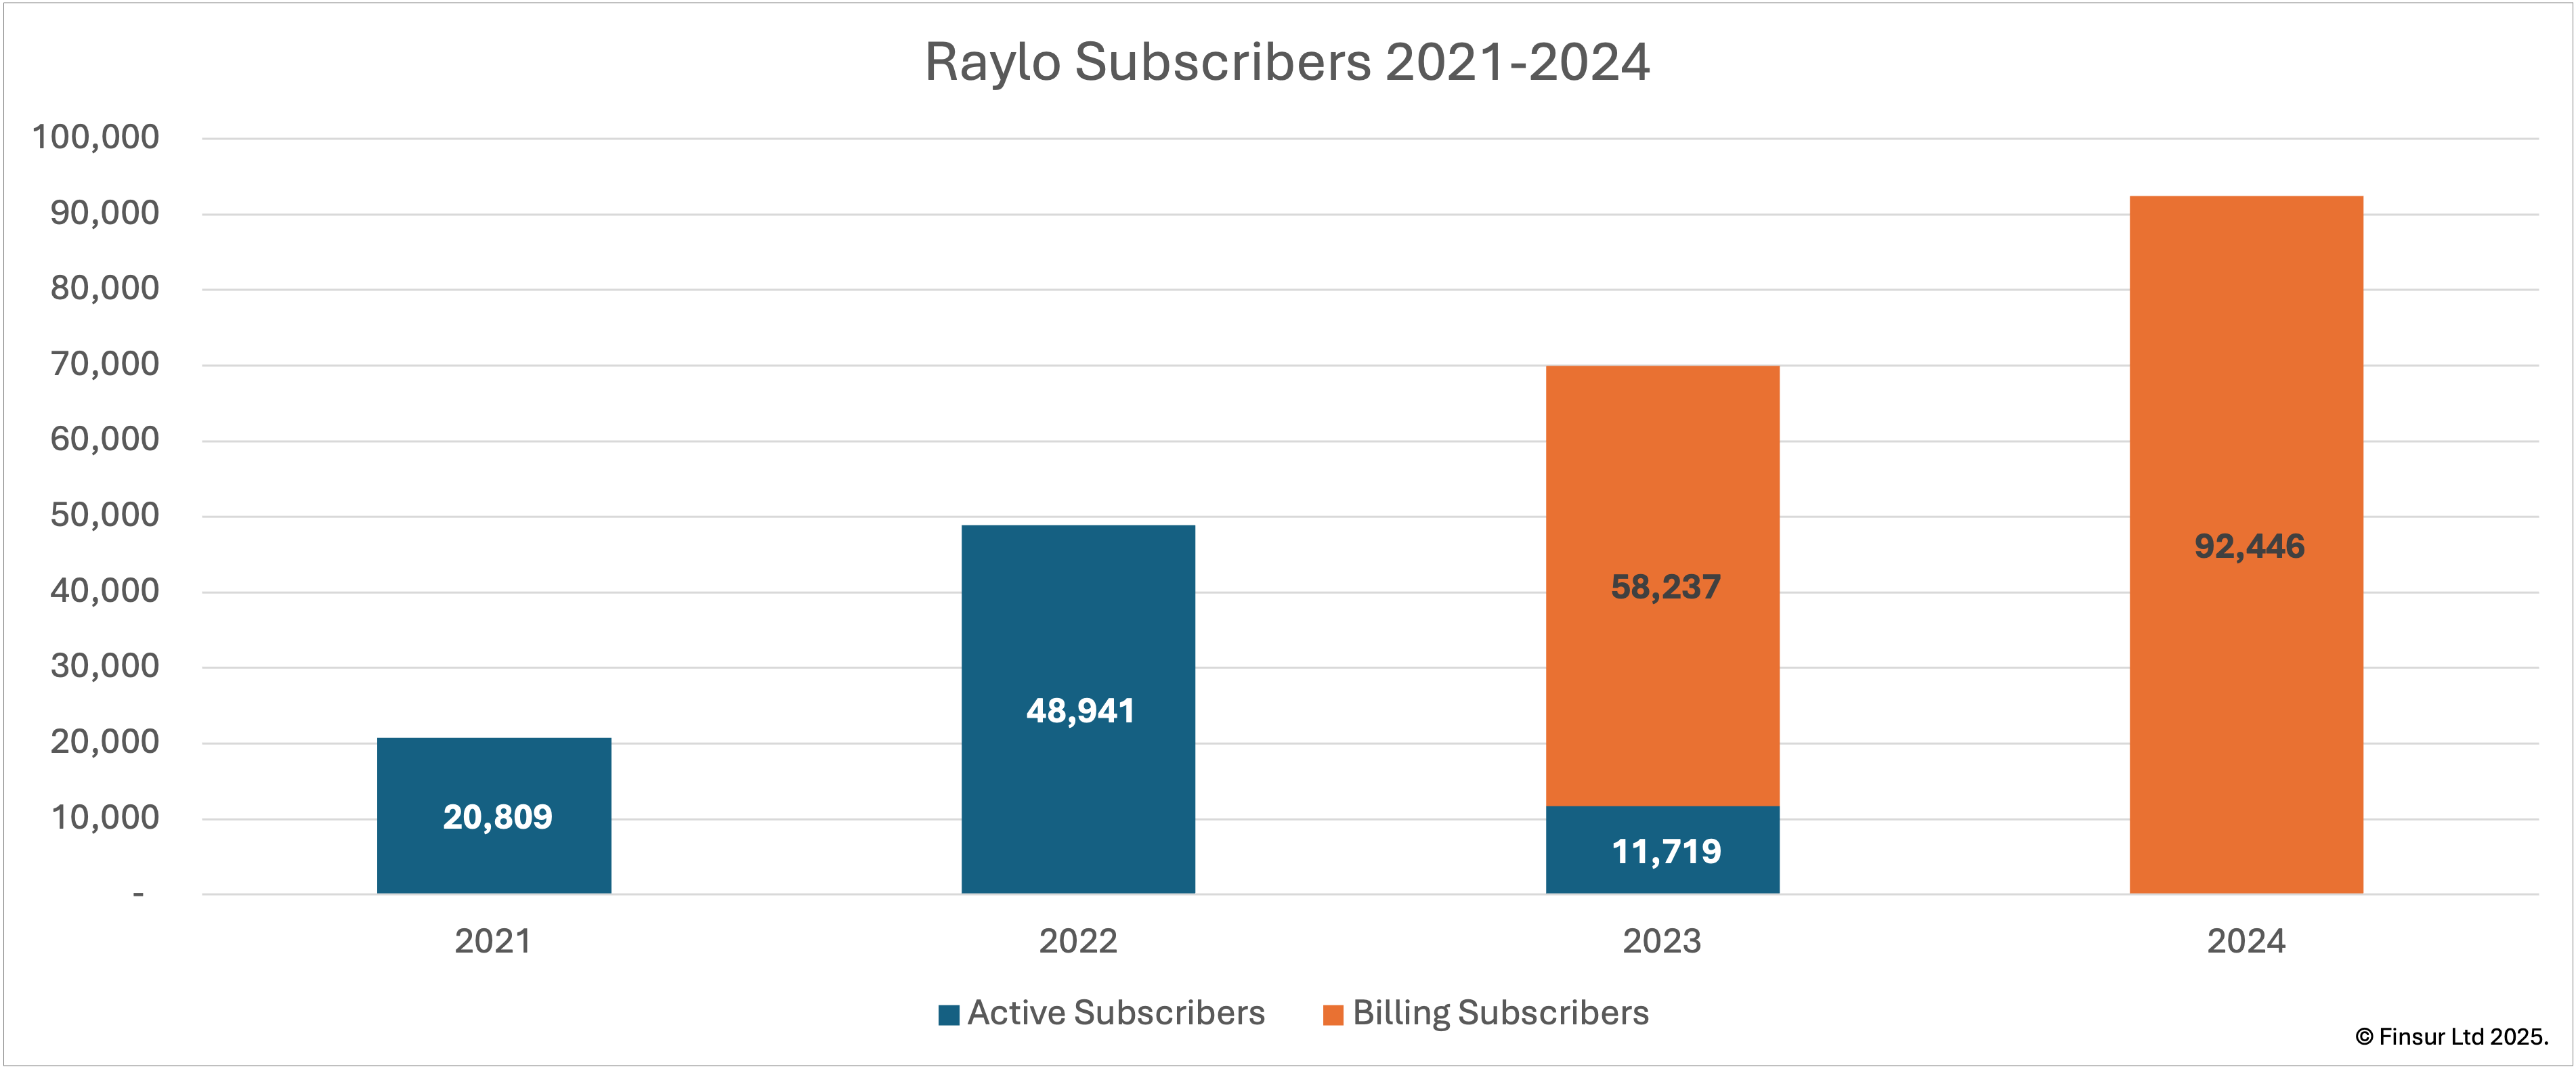
- Billing Subscriptions: 92,446 (FY2023: 58,237, +59%)
- ARR: £30.4m (9% forward momentum vs statutory revenue)
- Gross Profit: £20.6m at 74% margin (FY2023: 60%)
- EBITDA: £5.6m at 20% margin (FY2023: -£1.9m loss)
- Annual Billing per Subscriber: £329 (FY2023: £337)
- Existing Customer Profit Contribution: £1.4m
- New Customer Acquisition Investment: £6.9m
Source: Raylo Group Limited (11554120) and Raylo Holding Limited (14477387) filed accounts for year ending 31 December 2024
Raylo posted £27.9m revenue in FY2024 increasing 42% over their previous year’s total of £19.6m. All £26.0m of rental revenues now come directly from consumer hire agreements as opposed to 81% in FY2023 with the remainder coming from the sale of customer receivables. This now feels far cleaner and has likely been enabled by enough historical data to tighten up underwriting and improve risk management. Asset sales amounted to £1.9m, up from £1.4m previously.
The story around subscriber improvement is clear, although a little confusing at first glance. The FY2023 Raylo Group accounts reported 69,956 active subscriptions but the FY2024 Raylo Holdings accounts show only 58,237 billing subscriptions for the same period, an 11,719 difference. This might reveal the gap between operational activity and revenue generating relationships. Impressively, in FY2024 Raylo reported 92,446 billing subscriptions, representing a genuine 59% growth in customers contributing to revenue.
There’s no explanation for the definition change, but I assume the KPI includes Raylo’s B2B customers and RayloPay customers acquired through the likes of iOutlet (see here) for example. Nevertheless, this is an extremely positive improvement after the already decent 43% rise from FY2022 to FY2023. Proof perhaps that their multi-channel acquisition strategy is paying off.
Whilst revenue and subscribers were up, annual billing per subscriber decreased slightly from £337 in 2023 to £329 in 2024 (a £8 drop). There’s no commentary to suggest why, but I’d take a guess at either acquiring customers at slightly lower price points in order to drive growth or, reflecting B2B2C expansion where partner channel economics might differ from direct-to-consumer pricing. The marketing dollars vs. commission dollars trade off.
In addition to the £27.9m in revenue, management hint at additional future improvements by letting us in on the £30.4m ARR figure which deserves a mention. This represents about 9% forward momentum, a tangible indicator of acceleration through the year, presenting an even more optimistic view than the statutory accounts alone would suggest.
Continue reading for:
Complete Profitability Analysis including customer segmentation economics
Balance Sheet & Cashflow Assessment
Customer Proposition and competitive pricing analysis
Strategic Summary including break-even projections and sector outlook
Also available to download as a pdf report here