UK Mobile Device Market 2025: Apple's Refurbished Dominance and Channel Consolidation
Annual consumer survey reveals refurbished market segmentation, marketplace disruption, and lifecycle extension. Part 1 of 2: Device purchasing patterns (n=1,001)
About this time last year I ran a consumer survey to determine if there was any difference in insurance attachment rates between new and refurbished mobile phones1. It turns out there was:
Customers buying a new phone were 12 times more likely to see an offer for insurance than those buying a refurbished phone.
When an insurance offer was made, new phone customers were 40% more likely to buy it.
Buyers of new phones were 1.4 times more likely to acquire insurance after their phone purchase than buyers of refurbished phones.
The survey also kicked up some useful data on device purchasing and began to highlight a shift away from consumers buying phones from the usual telecoms companies.
This year, I’ve run the survey again, with a larger sample size (n=1000) and a few more questions so I’m splitting the results over two articles. This one covers the device findings and Part 2 next week will focus on the insurance findings.
Headline Stability
At the high level, the main indicators have remained pretty much stable. Consumers choosing to purchase a refurbished device declined very slightly from 15.8% in 2024 to 15.4% in 2025. The Telco channel remains the preferred point of purchase and up just a touch from 39% of consumers in 2024 to 39.2% this time around. Apple maintain their position as the favoured phone brand at 43% share with Samsung following at 36% making for a combined duopoly of 79%. But, beneath the surface stability, consumer behaviours within these segments show more variation.
Deeper Insights
Channel Share
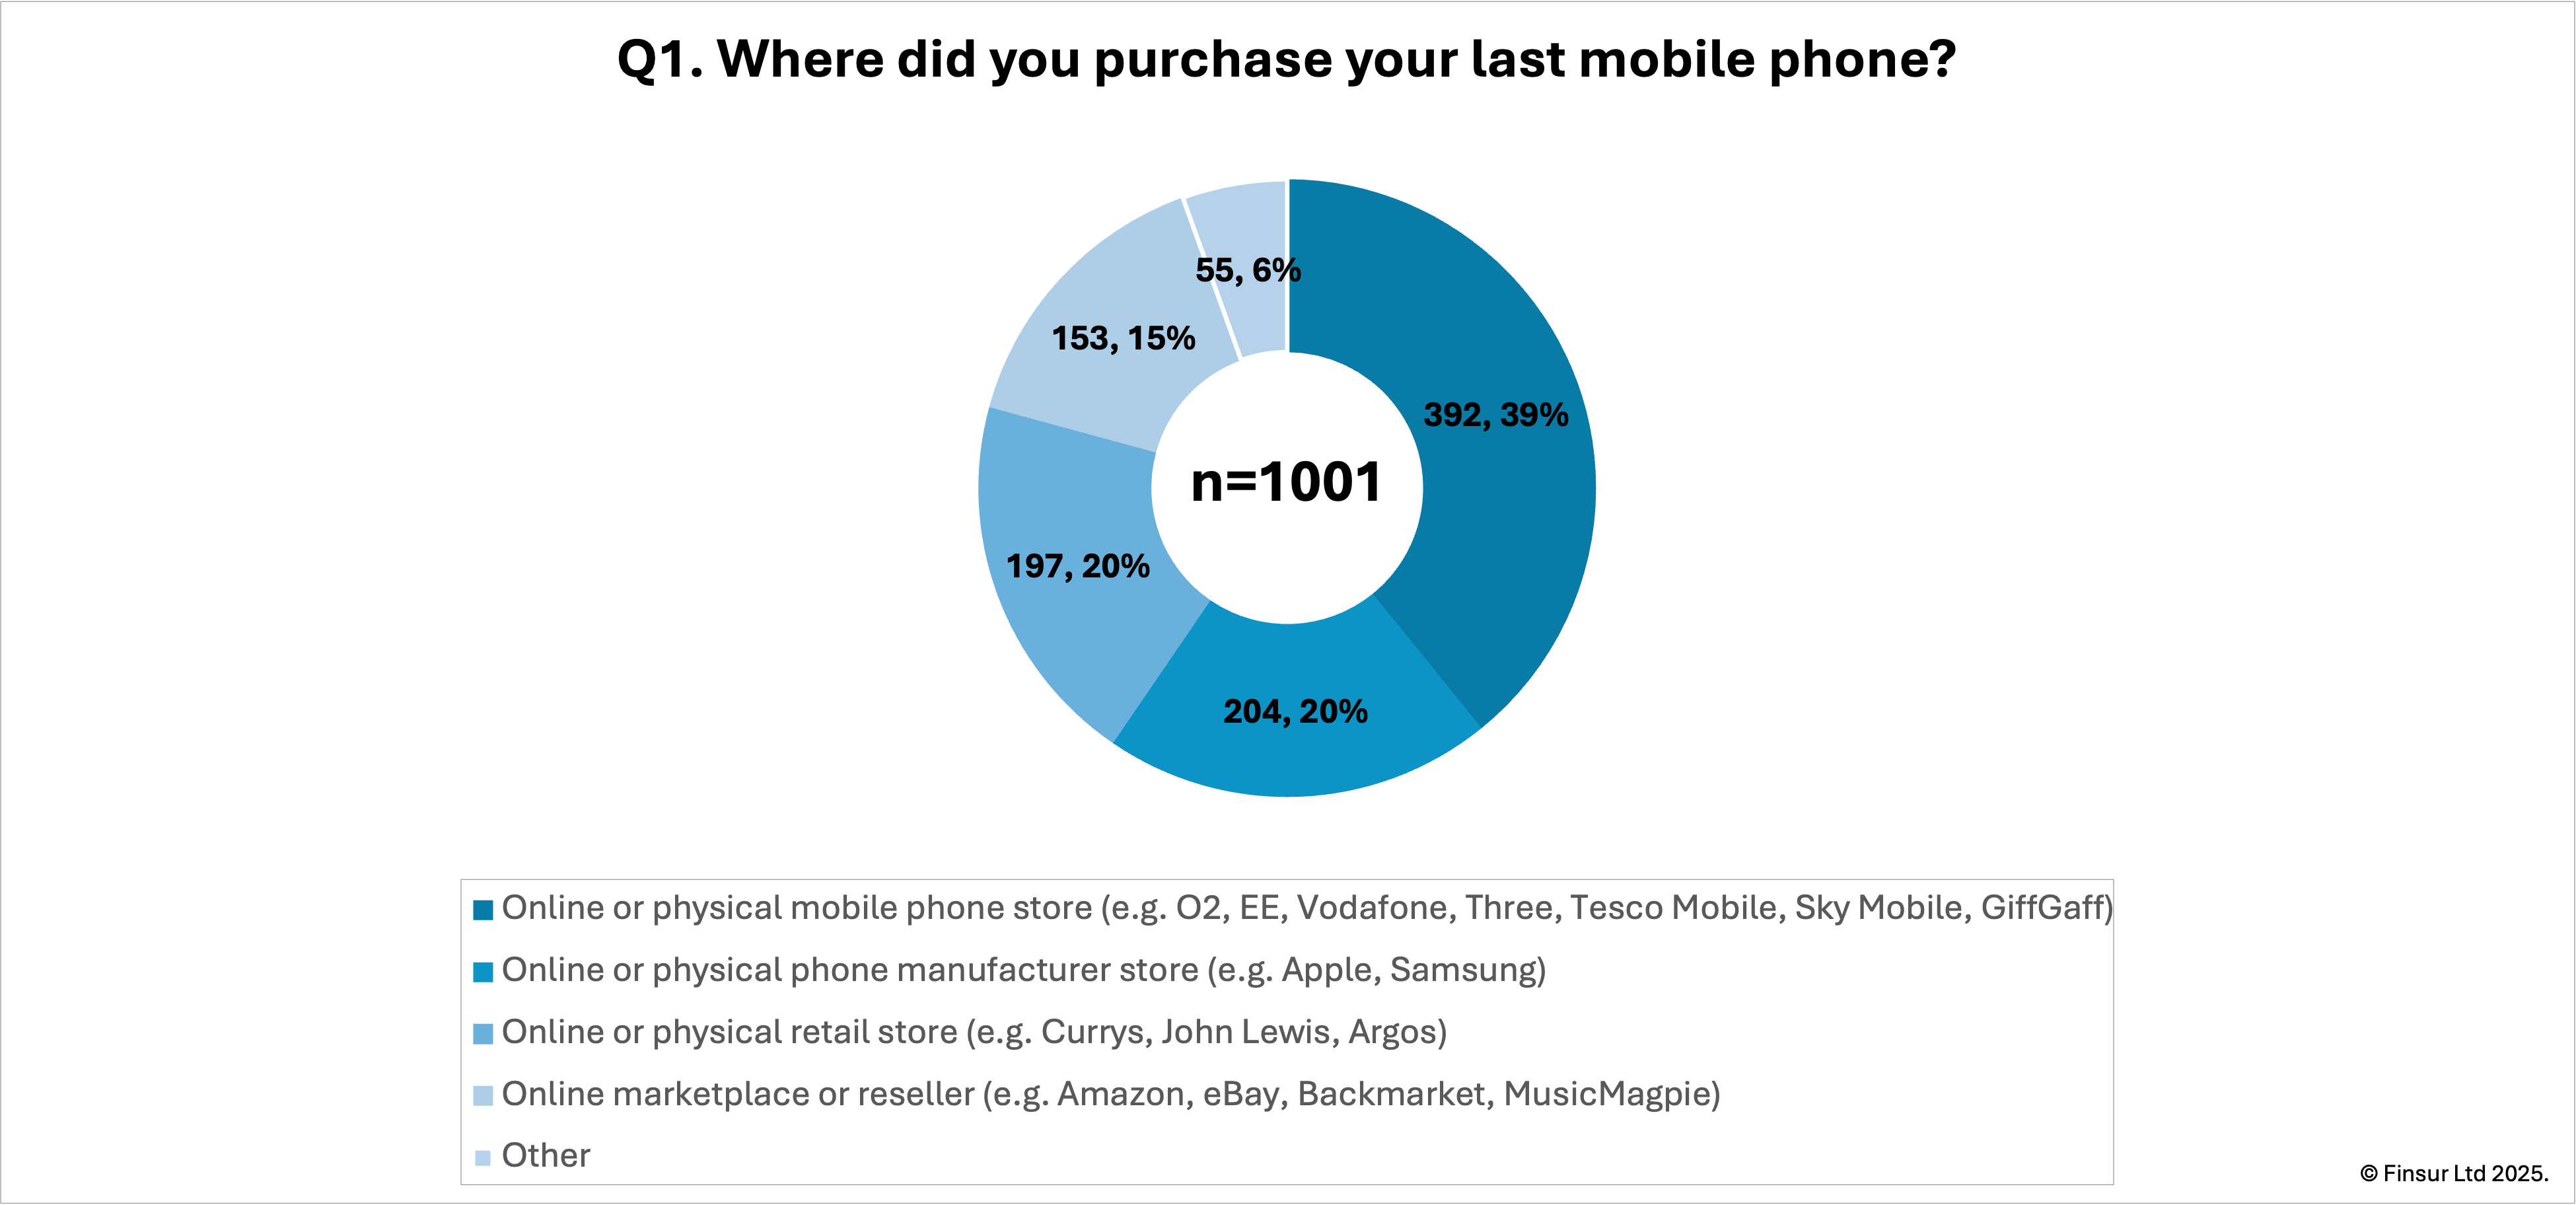
As expected, the telecom stores still captured the largest share of purchases at 39.2%. The combined retail and marketplace channels accounted for 35% of sales against 32% last year. Interestingly, responses indicate that manufacturer store preference dropped from 23% of the share last year to 20.4% this year, although, there is some variance by brand with 24.8% of Apple buyers choosing to bag their new phone directly from Apple, whilst Samsung buyers going direct was 7.6% lower at 17.2%.
Additionally for this year, I split the multi-channel retailers (e.g. Currys, John Lewis, Argos) which captured 19.7% of the market and the online only retailers and marketplaces (e.g. Amazon, eBay, Backmarket, MusicMagpie) who accounted for 15.3% of total sales and 46.1% of all refurb sales, which was to be expected given the question phrasing.
As a footnote, the survey also provided a little insight into the unorganised secondary market with 2.8% of device acquisitions being gifts or hand-me-downs from family members with 0.4% of phones purchased directly from friends. This would take the refurbed / secondhand purchases from 15.4% in the organised market to a total market share of 18.6%.
There were also a couple of side notes for me: 1) Raylo was mentioned, which makes me think I need to add payment method to the next survey; 2) Community TechAid were noted and their mission is worth a click, and; 3) Three clearly have some disgruntled customers unhappy with their replacement devices.
Refurb Market Segmentation
The 15.4% refurbished device share, shows clear segmentation by quality expectations and price tolerance. Quality standards dominate buyer preferences: 63% of refurb purchasers chose either pristine/excellent/very good condition (49.4%) or manufacturer certified refurbished devices (13.6%), with only 4.5% accepting fair or acceptable condition phones. This makes sense. If you’re buying a refurb, you probably want one in the best condition possible.
Price distribution reinforces this quality focus. Among refurb buyers who recalled their purchase price, 63% spent under £400, whilst 21% paid £400 or more, a price point that overlaps with new mid-range devices. The relationship between condition and price shows expected patterns: buyers choosing “good condition” devices skew heavily toward lower prices, while those seeking certified or pristine condition are more willing to pay premium prices. That might mean there are two distinct value propositions in the refurb market. A cohort of budget-conscious buyers trading condition for savings and, quality-focused buyers trading newness for value.
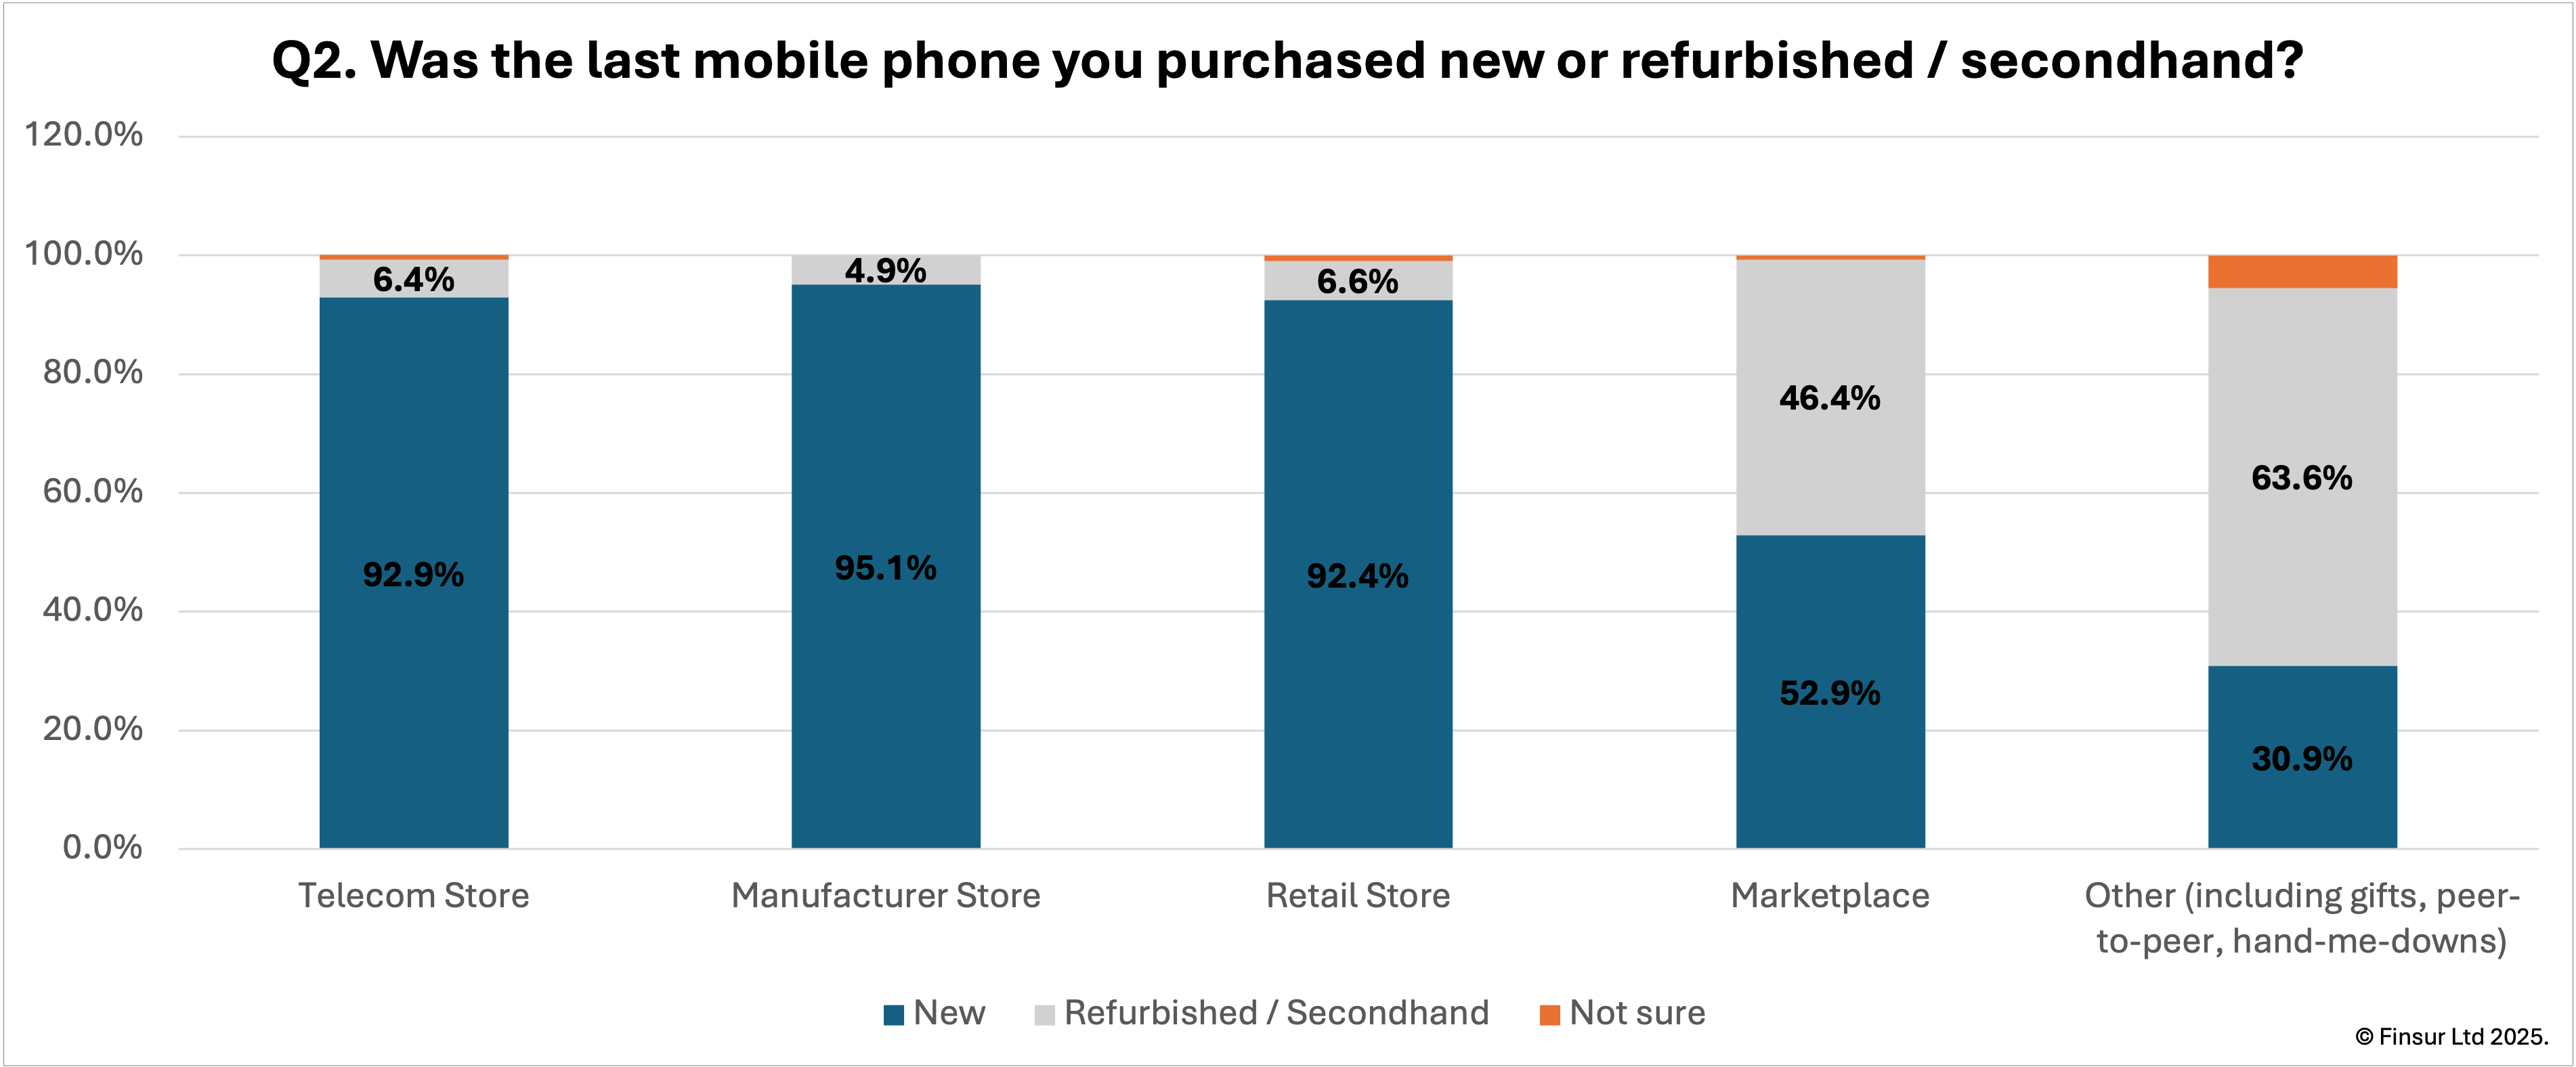
Channel patterns reveal distinct distribution strategies. Traditional retail channels, telco stores, manufacturer stores, and multi-channel retailers all sell refurb devices at low single-digit rates (between 5-7% of their mix), focusing almost entirely on new sales. As expected, the marketplace channel shows a near-even split: 53% new versus 46% refurb, positioning these platforms as the primary formal refurb distribution channel. Companies that have begun to include device collections and sales in their sustainability metrics will need to work much harder to capture their target shares.
Demographics show sustainability attitudes drive refurb adoption more strongly than income. Among buyers citing sustainability as having “a lot of influence” on purchasing decisions, 34% chose refurb devices. This drops to just 11-12% among those citing little or no sustainability influence, a 23 percentage point difference. Income shows a more modest gradient with refurb adoption declining from 18% among those earning under £25k to 11% among those earning over £100k.
Three distinct buyer types emerge from these patterns:
“Premium Refurb” buyers seeking certified or pristine condition devices, often paying £400+, purchasing through marketplaces or manufacturer channels.
“Value Refurb” buyers prioritising price over condition, accepting good or fair condition devices under £400, often through peer-to-peer channels.
“Sustainability Refurb” buyers span both groups but show stronger preference for higher-quality refurb options, suggesting environmental concerns don’t necessarily mean accepting lower quality.
Apple’s Refurb Advantage
As we could all probably attest, Apple’s performance in the secondary market stands out. Of all the Apple buyers surveyed, 20.2% chose a refurbished device, well above the market average of 15.4%. Samsung buyers on the other hand, opted for a refurb at just 11.9%. This translates to Apple capturing 56.5% of all refurb purchases off the back of a 43.1% overall market share.
Still, it’s not all as it seems. Apple refurb buyers show a condition preference slightly below that of the market. 55% of buyers selected either pristine / excellent / very good condition or certified refurbished compared to 63% across the market. There is also a notable difference in price tolerance, with 29% of Apple refurb buyers paying £400 or more for their device compared to 21% across the board, meaning that Apple buyers are demonstrating a greater willingness to pay a premium for devices in average or lower grade conditions.
To some extent this simply reflects premium brand economics. Strong residual values mean even fair condition Apple devices command prices that can exceed some new mid-price alternatives. But, it’s unlikely that Apple refurb buyers are choosing to pay the premium despite the lower quality. It’s far more likely that they’re accepting lower grade devices to access Apple’s ecosystem at a price point they can afford.
Samsung, on the other hand appear to face some structural constraints. Weaker residual values mean that refurb Galaxy devices often compete directly with discounted new models. Frequent promotional pricing may be training customers to wait for deals rather than consider refurbished. Where Apple consistently maintain price discipline, Samsung does not, compressing the space available for healthy refurb economics.
Despite my previous scepticism, there is some indication that sustainability attitudes correlate with Apple refurb adoption, as opposed to purely price. Although, the relationship is complex. Among Apple buyers citing sustainability as having “a lot of influence” on purchasing decisions, 40% chose refurb devices, exceeding both the overall market rate for sustainability driven buyers (34%) and Apple’s baseline refurb rate (20%). While sustainability concerns shows modest correlation with income (11% of high earners cite high sustainability influence versus 6% of those earning under £25k), the pattern holds across income bands. Perhaps the continued positioning of refurb as an environmentally responsible choice is beginning to appeal to eco-conscious consumers who prioritise brand and longevity over pristine aesthetics.
Income patterns show Apple refurb adoption declining from 29% among those earning under £25k to 13% among those earning over £100k. The higher rate among lower earners may include switching from other brands, though it equally likely represents existing Apple users trading down from new to refurb. The presence of refurb adoption among high earners (13%) suggests the technology ceiling plays a part with previous-generation devices meeting utility needs without paying the new premium.
Price Dynamics
New device pricing distribution is naturally wider across price bands than refurbed. 20.5% of new device buyers spend under £200 on entry-level devices, mostly in the 65+ age group. There follows a relatively even distribution of 11% to 14% in each subsequent band up to £800 and finally, 26.1% of respondents spending over £800.
Predictably, premium device spending (£800+) increases steadily with income, rising from 11% among those earning under £20k to 40-48% among those earning over £100k. Premium device spending peaks among the 25-34 and 35-44 age groups at 38.9% and 36.3% respectively in the £800+ band reflecting peak earning years combined with higher technology engagement than older cohorts. The 65+ cohort is revealed as the most price-sensitive, with only 12.8% spending £800 or more.
The relationship between device price and replacement cycle shows a counterintuitive pattern. Among premium buyers spending £800 or more, 28.9% replace their devices within two years, compared to 19.7% of those spending £400-£799 and 12.7% of those spending under £400. Conversely, 31.2% of budget buyers keep their devices for five years or more, versus 19.3% of mid-price buyers and just 16.4% of premium buyers. This inverts an expected pattern where premium devices might justify longer ownership. Instead, premium buyers appear to maintain shorter replacement cycles, suggesting different usage patterns, stronger upgrade motivation, or simply having the means to replace devices more frequently regardless of device condition.
Demographics
Basic demographic patterns reveal distinct segmentation in device purchasing behaviour, with age, sustainability attitudes, and income showing meaningful influence on refurb adoption, whilst gender and location prove largely irrelevant.
The survey results show that age emerges as the strongest predictor of refurb adoption. The 18-24 cohort shows the highest refurb rate at 25.5%, declining steadily through age bands to 13.2% among those aged 65+. The variation suggests younger buyers either face greater price sensitivity, have more comfort with secondhand technology (which is mostly sold online), or respond more strongly to sustainability messaging around refurbished devices.
Obviously perhaps, sustainability attitudes correlate strongly with refurb purchasing. Among buyers citing sustainability as having “a lot of influence” on purchasing decisions, 34% chose refurb devices, dropping to just 11-12% among those citing little or no sustainability influence. Interestingly, sustainability concerns show a modest correlation with income, with 11% of high earners citing high sustainability influence versus 6% of lower earners.
Urban dwellers show marginally higher refurb adoption at 16.6% compared to rural areas at 13.2% and towns at 13.9%, likely reflecting greater access to refurb retail channels rather than fundamental preference differences. Gender shows no meaningful variation in either new versus refurb purchasing or premium spending patterns.
The demographic profile points to refurb buyers skewing towards younger, more sustainability-conscious, and modestly more price-sensitive, though none of these factors proves deterministic. The weakness of location and gender effects may suggests refurb adoption has moved into broader market acceptance.
Replacement Cycle
The modal replacement cycle from the survey sits at 3-4 years, accounting for 51.5% of respondents, with 23.9% keeping devices for 5 or more years. At the sharp end, 17.0% are replacing within 1-2 years. These figures align closely with findings from my May 2025 survey2, which showed consumers intending to extend average ownership from 3.40 years to 3.67 years, suggesting the behavioural shift towards longer device lifecycles continues to manifest.
Age demonstrates the strongest correlation with replacement behaviour. The 65+ cohort keep devices longest, with 34.0% holding phones for 5 or more years and only 12.7% replacing within two years. This contrasts sharply with the 35-44 and 45-54 age groups, where 21.8% and 22.4% respectively replace devices within two years. The 18-24 cohort presents a bifurcated pattern with 31.3% keeping devices for 5+ years, possibly driven by budget constraints, whilst 18.8% replace within two years, suggesting a segment of early adopters within this younger demographic.
New versus refurbished device owners show a modest but meaningful difference in replacement cycles. Refurb buyers demonstrate marginally longer ownership: 26.0% keep devices for 5+ years compared to 23.5% of new device buyers, whilst only 11.7% replace within two years versus 18.1% for new device purchasers. This extended lifecycle among refurb buyers may reflect either deliberate sustainability-driven behaviour or price sensitivity encouraging maximum value extraction from devices.
Brand patterns reveal limited variation. New Apple device owners show 17.8% replacing within two years and 22.5% keeping devices 5+ years, compared to Samsung’s 22.8% and 20.8% respectively. The modest difference suggests replacement behaviour correlates more strongly with price point and age than brand loyalty, as explored in the Price Dynamics section.
Market Implications
Lifecycle Extension Validates Contraction Thesis
The survey confirms the structural shift identified in May’s research: 51.5% of consumers maintain 3-4 year replacement cycles with 23.9% extending to 5+ years, up from the 3.40-year average previously observed. This represents a fundamental market compression rather than cyclical downturn.
If the intended 3.40 to 3.67 year extension fully materialises, the annual market for new devices shrinks by approximately 8%. For manufacturers, in the absence of longer product release cycles, this requires a premium product mix shift to maintain revenue on lower volumes, or additional ecosystem service revenue to compensate for reduced hardware turnover. Refurb market expansion becomes structurally inevitable as devices entering secondary circulation increase while replacement demand contracts. The counterintuitive pattern where premium buyers (£800+) replace devices fastest (28.9% within two years vs 12.7% for budget buyers) suggests the contraction concentrates among mid-market consumers, potentially splitting the market into premium frequent-upgraders and budget long-holders. Extended ownership cycles could shift value capture toward mid-life services. Repairers for example should benefit from increased maintenance demand on aging devices, as long as the price point is compelling (growth curves are functions of marketing, rarely natural phenomenon). Trade-in companies (including marketplaces) are likely to face continued margin pressure as older devices (4+ years vs 2-3 years) enter programs with lower residual values and as manufacturers and the telcos fight harder to get their devices back.
Apple’s Refurb Dominance Creates Asymmetric Opportunities
Apple captures 56.5% of refurb purchases despite 43.1% overall market share, with 20.2% of Apple buyers choosing refurbished versus Samsung’s 11.9%. Among sustainability-conscious Apple buyers, refurb adoption reaches 40%, demonstrating brand loyalty enabling trade-downs without switching.
Apple’s strong residual values create a self-reinforcing cycle where high new device prices generate viable refurb economics, which in turn support trade-in values that materially subsidise new purchases (condition dependent). This positions Apple to capture value across the entire device lifecycle in ways Samsung cannot replicate without fundamental pricing discipline changes. However, the potential for higher margins with Apple refurb faces compression from intense marketplace competition and supply constraints, while Samsung’s weaker residual values and frequent new device promotional pricing leave limited space for a healthy refurb market to develop. Apple’s certified refurbished programme and trade-in infrastructure position the company to capture more of this value directly over time. But as it matures, the asymmetry likely intensifies, potentially squeezing the independent organisations who cannot match manufacturer-backed warranties and certification. Samsung’s path forward requires either accepting lower margins on refurb to build secondary market presence, or doubling down on new device innovation cycles that obsolete older models faster, neither being particularly attractive.
Refurb Market Segmentation Points to Consolidation
The refurb market divides clearly: 63% choose pristine/certified condition devices, with 21% paying £400+, overlapping new mid-range pricing. Only 4.5% accept fair/acceptable condition.
The size of the quality-focused segment presents a structural challenge for traditional retail. Telcos and multi-channel retailers operate at 5-7% refurb mix whilst marketplaces run near-parity (53% new, 46% refurb). This gap reflects distinct operational requirements. Established retail lacks the reverse logistics, grading infrastructure, and inventory management systems that the marketplace and B2B specialists have built. Rather than invest in replicating these operations, consolidation becomes the logical path. The AO/MusicMagpie acquisition in the UK signals this direction, as does the recent Backmarket-Bouygues tie up in France3 or the new Vodafone-Recommerce store in Germany4. Expect to see more partnerships, white-label arrangements, or acquisitions as telcos and retailers recognise they need specialist refurb operations to serve the quality-conscious segment.
Conclusion
Three findings carry structural weight. Lifecycle extension compresses the total addressable market by approximately 8%5, shifting value toward mid-life services whilst intensifying competition for trade-ins. Apple’s refurb dominance, capturing 56.5% of refurb volume on the back of 43.1% market share, creates a self-reinforcing cycle through strong residual values that Samsung will not replicate without pricing discipline. The quality-focused refurb segment reveals capability gaps driving partnerships and acquisitions between traditional retail and marketplace specialists.
Part 2 next week: Insurance Market Analysis (Paid Subscribers Only)
Last year, refurb buyers faced a 12x lower insurance offer rate than new device buyers. Has that gap closed in 2025? Part 2 answers:
Did the refurb insurance gap (12x offer rate, 40% lower attachment) persist or narrow?
Which purchase channel achieves the highest insurance attachment rates?
How does Apple’s 20.2% refurb adoption affect the addressable insurance market?
What does the quality-focused refurb segment (63% pristine/certified buyers, 21% paying £400+) mean for device protection pricing?
Part 2 will be available exclusively to paid subscribers. Subscribe now to receive the insurance analysis in your inbox next week, plus access to all future market research.
Peace,
sb.